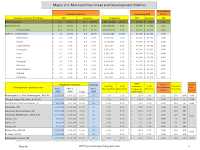
The advantage of using the Development Metric calculation method minimizes the variability impact of population and economic activity estimates from Wikipedia and the CIA World Fact book (or any other data source) against data manipulation or claims of inaccuracy. The variability of estimates has very little impact relative to the comparative calculated Development Metric value.
Website Translator
March 21, 2011
Metropolitan Based History of Economic Development
Economic development has historically occurred within cities as a result of a collective marketplace of goods, service offerings, employment, & entrepreneurial opportunities. Photos in this blog post reflect historic locations of metropolitan economic developments. An important fact to notice is the concentration of development between the 45°N to 15°N lines of latitude. The benefits of collective interest based Economics are evident in metro development as are decision impact differences and influences among Education, Social Well-being, and budgeting priorities of Social-Political community agreement processes (Southern political philosophy development correlation) resulting from taxation policy & allocations. Suburban development is the beneficiary of successful metropolitan economic development expansion to reduce population overcrowding. The Metropolitan Areas Development Metric analysis supports the fact that city and urban development leads (leading indicator) to statewide economic development attributable to collective resources utilization.
The advantage of using the Development Metric calculation method minimizes the variability impact of population and economic activity estimates from Wikipedia and the CIA World Fact book (or any other data source) against data manipulation or claims of inaccuracy. The variability of estimates has very little impact relative to the comparative calculated Development Metric value.
The advantage of using the Development Metric calculation method minimizes the variability impact of population and economic activity estimates from Wikipedia and the CIA World Fact book (or any other data source) against data manipulation or claims of inaccuracy. The variability of estimates has very little impact relative to the comparative calculated Development Metric value.
March 7, 2011
Taxation Concept for Competitive Development
Much of the political debate regarding business policy occurs with differences attributable to the varying “languages” of interest groups and government's comparable functional role. The assumption is that all are working for the future interests of the United States of America. Considering this in addition to the analysis of the current competitive standing of the country illustrated in The Global Competitiveness Report, here are some ideas regarding the taxation and policy debate.
My blog post The United States and Global Competitiveness summarized the common categories for the very top tier countries of competitiveness and personal thoughts on the socio-economic development relationships. The derived conceptual taxation strategy includes these important competitive factors similarly identified in the World Economic Forum’s competitiveness report methodology structure. This proposal creation identifies categories for industry assignment and tax rate development considering: A) Utilization and depletion of resources factoring environmental costs of disaster cleanups and necessary government public safety regulatory concerns; B) derived Infrastructure impact benefits [“hard” costs of interstate maintenance, airport and air safety, national utilities system maintenance and upgrades; “soft” costs of institutional (education and legal) demands on human resources development and general government administration]; C) the American community social and economic development flexible funding for investment into future competitiveness; and D) Security and National Defense interests. The Rate would apply to all industry companies within the category.
Currently, the conceived industry category groups are:
Basic Factors Efficiencies
I. Natural Resources (Utilization and Depletion) III. Service Oriented
II. Infrastructure V. Other Pass-through (Income / Consumption)
Innovation
IV. Knowledge (Education) Based – [Science & Technology Advancement]
This approach incorporates many ideas from the taxation debate and social interest groups to tax industry with equivalent relative matching to the “tax” on global development. The factored “flat rate” for each category includes environmental and social impacts; patriotism for U.S. interests; contribution to U.S. future development while protecting the interest of generational contributions; and redefines the debate terminology with a perspective of all vested interests during times of budget and spending reductions.
March 3, 2011
The United States and Global Competitiveness
The United States has long been considered the pre-imminent global business environment as a result of the development of the country’s resources identified by the valuation as the world’s leading economy. Globalization focused development of critical resources for commercial growth to improve standards of living has increased competition and will force critical decisions to maintain the recognized leadership and global strategic position.
Review of The Global Competitiveness Report of 2009-2010 from the World Economic Forum, the United States is ranked 2nd overall and ranked within the top 5 of countries in four of the twelve evaluative categories:
Market Size…1 Innovation..…1 Labor Market Efficiency….3 Business Sophistication…5
Also recognized by the report committee, the variables of determination are not mutually exclusive to determination of successful, progressive economic performance. However, it is clearly understood that providing quality education and maintaining a healthy population are very good for societal development toward such a goal. Both are current topics of political discussions. The following summarized version of the Global Competitiveness Report reflects the United States ranking within the 12 categories of study along with the identification of the top five countries within each. Given that the U.S. is currently ranked 3rd in Labor Market Efficiencies, maybe political-legislative discussions should focus efforts on other areas for improvement. My personal data inference from review of commonalities among the top ranking competitive countries is that strong (1)Institutions build (5)Higher Education & Training opportunities leading to (12)Innovation creating (9)Technology Readiness and (6)Goods Market Efficiencies.
February 21, 2011
February 19, 2011
Subscribe to:
Comments (Atom)


