Website Translator

Showing posts with label World Data Comparison. Show all posts

February 15, 2011

Global Economic Development: A Data Graphic Introduction

Beliefs? Systems[Methods]? Authority? Results?

Initially wanted the beginning phases of dialogue to discuss this topic while including many of the graphics I have prepared up to this point. However, after including the needed graphics, an extended introductory essay would make the post too long. Thus, follow-up posts will explain and refer to the relationships among the graphics relative to current economic experiences and associated coordinations (Ideology strategies). Including the influence of religious and biblical interpretations on societal-industry economic development; stereotypes-beliefs-legal influence probabilities; tactics to fraternal obligations using political constituencies / institutions for advantage; resource ownership financing benefits resulting from economic leadership; and the need for reinforced constitutional legal protections against U.S. conservative mystic fraternal intelligence "family" religion economic system genome (s)exploitations orchestrated to create a special operations pronoun narrative for pre-defined demographic solidarity commitments [or development of the argument removing ethnic-based "family" restrictions/obligations on mutually-agreed emotionally healthy, non-exploitive relationships](re: Personal Evidentiary Theory and Relativity Management Theory XX and XY blog posts).


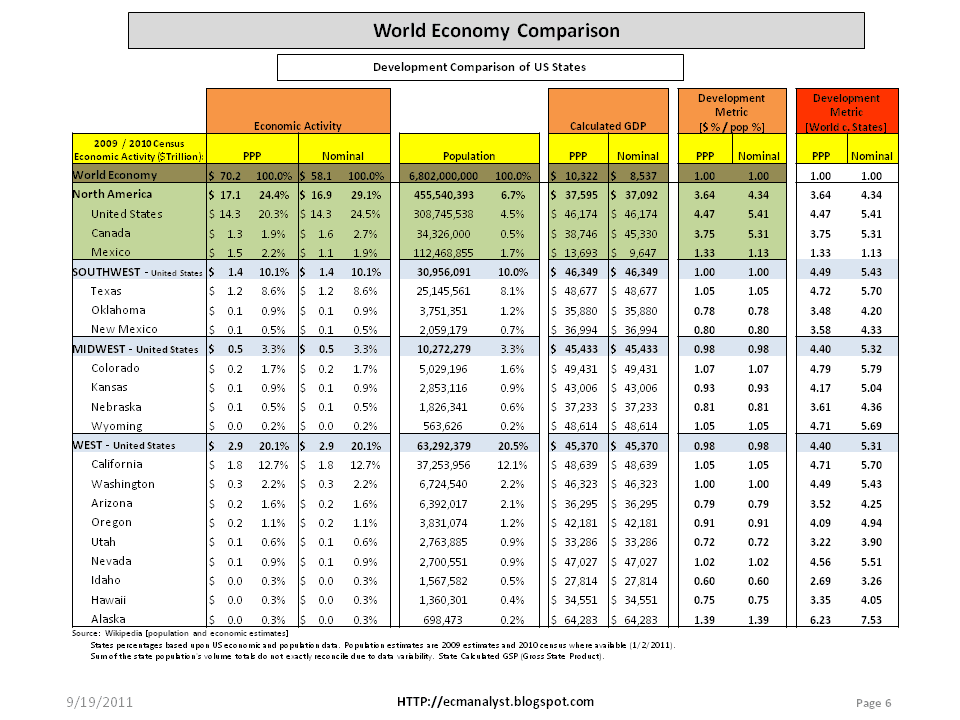
Note: Preferences based upon a statistical sample of population responses (non-significant R2).
U.S. based Development Metric is 1.00, the 0.96 avg reflected in the statistical analysis is a result of non-reconciliation of state population data variability to total population.


Theoretical humankind Influences - How it could conceivably happen
1.   Roswell [timing, timeline]
2.   Military hierarchy infiltration
3.   Intelligence Organizations / Fraternal (secrets) "agreements" - (J.E. Hoover)
4.   Technology / Corporations / investment [military spending history]
5.   Political infiltration / Elections [morality focus / leverage]
6.   Conservative Ideology & Church [worship/ financing/ Coptic - Mystic abilities?]
7.   Relationship Privacy Protection fraternal "royalty" fee? [morality?]
8.   Legislative branches of government [banking industry?]
9.   Medical - Science research - education institutions (information collection)
10. Human Genome / DNA studies control / stereotypes & procreation exploitation?
11. Executive influence ["NWO" --> Faith politics --> Change? (banking crisis?)]
12. Intelligence Special action plan (strategy) reveal? Social "fraternal" commitment? Constitutional? No!
*re: Relativity Management Theory XX and XY [Episode I]: Time - Space - Dimensions and Technology

Updated: August 26, 2016 [added video]


January 4, 2011

World Data Comparison III - Europe Economic Development Metric Analysis

Continuing with the usage of the Development Metric, the country listing from the quadrant analysis in the Social Spending and Economics and Assets and Values postings was amended adding the calculated metric. There were no new surprises but it does provide for a better evaluation, excluding earnings distribution, among the countries.[revision 11/17/2011]

---------------------------------------------------------------------------------------------------------------------
Updated 1/27/2011: Sorted the European countries listed from the quadrant analysis by the Development Metric. (Note the metric sorted location of Portugal, Greece, Spain, and Italy in the list).

December 17, 2010

World Data Comparison II


While reviewing more data regarding development around the world, I wanted to find some comparative measure for usage when discussing growing economies and global competition. The leading developed nations and economic strengths in North America and Europe are common knowledge. Much attention has been placed upon the growth in developing countries with a current focus on China and Brazil. So, I decided to look at a relative comparison to assess the economic - political positions to society. For integrated societies with comparable stages of development and resources, there always exists the possibility of disagreement which could lead to non-optimal actions impacting global economies. However, the BRIC nations’ growth appears to be a natural stage of economic development consistent with the European and American enlightenment period when investment was focused upon Math, Sciences, and technological advancement. The US is still 4 times the development of China, but population size is important. China’s economy would be ~$60 Trillion at a similar level of development.

This comparison approach measures world economic activity percentage relative to world population percentage. The development position of economic strength increases as each nation educates and creates opportunity for all of its citizens. 


November 7, 2010

World Data: A Comparative Look


Although not much of the data proves to be statistically significant from preliminary comparative analysis, evident is the relationship between Fertility (family size) and Economics (Per Capita GDP). In addition to Population Growth and Fertility, this is quite logical when you think about it. I thought taking a look at the relationship comparisons would be interesting and also supportive of the next blog post regarding Business Revenue and Profit Sources to show the importance of market creation through living standard improvements.